The blog considers a series of range helpful .NET performance metrics that can be used for identifying and diagnosing poor application performance.
Introduction
- This blog provides a brief overview of .NET run-time environment
- Performance metrics that assist in the identification and diagnosis of performance problems are considered
- The author is currently performance testing a large retail website built on .NET framework architecture
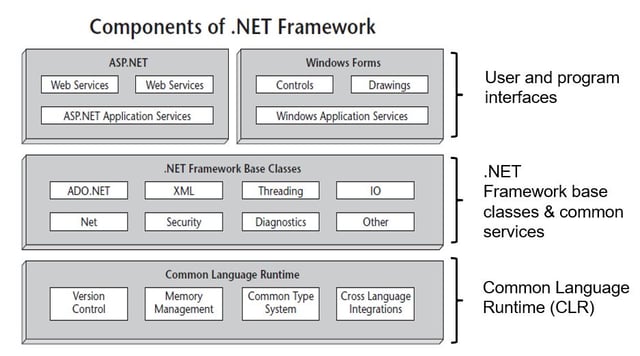
Constitution of .NET CLR

Features of .NET CLR
- Built in memory management
- Enhances application and infrastructure stability
- Memory objects undergo Garbage Collection to reduce the risk of memory leakage
- Common Type System (CTS) to enforce code robustness and language interoperability
- Enhanced performance
- Efficient Just-in-time (JIT) Compilation
- Server side applications
- Application scaling through threading services
- Worker threads in .NET
- Enhanced system security
- Increased programmer efficiency (allegedly)!
Managed vs. Unmanaged code
Managed Code
- CLR provides abstraction for developers
- Some configuration controls (threading, session)
- Don’t assume that management is effective
Un-managed Code
- Legacy code (E.g. Classic ASP)
- No CLR and limited run-time control
- Developers code management processes in their applications
- Memory leakage !
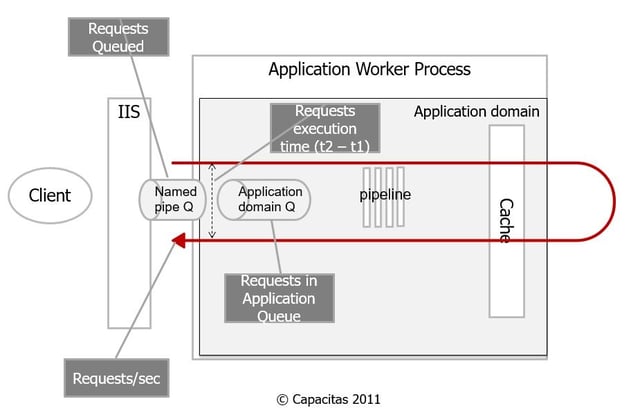
ASP .NET pattern

ASP .NET – Requests per second
ASP .NET Applications> Instance > Requests per Second
Measures throughput of the ASP.NET application on the server. It is one of the primary indicators that help you measure the cost of deploying your system at the necessary capacity
- A measure of the number or fulfuilled requests
- Is independent of the arrival rate for requests
ASP .NET – Requests Queued
ASP .NET Applications> Instance > Requests Queued
The number of requests currently queued in named pipe for application.
- Queued requests indicate a shortage of I/O threads and worker threads
- Queuing takes place if # worker threads < minWorkerThreads
ASP .NET Applications> Instance > Requests in Application Queue
The number of requests currently queued in the application domain
- The current number of requests, including those that are queued, currently executing, or waiting
ASP .NET – Request Latency
ASP .NET Applications> Instance > Request Execution time
The number of milliseconds taken to execute the last request.
- Time requests spend in application domain
- Results are pretty erratic and care should be taken in interpreting
- If the monitoring frequency is high enough then this metric can prove useful
.NET CLR - Physical worker process threads
.NET CLR Locks and threads > Instance > # Physical Threads
The number of native operating system threads created and owned by the common language runtime to act as underlying threads for managed thread objects
- High or increasing values may be an indication of thread blocking
- Garbage Collection or other
- Max threads limit is set by maxWorkerThreads
- Too many threads may be inefficient
- Check that system > context switches/s is not excessive
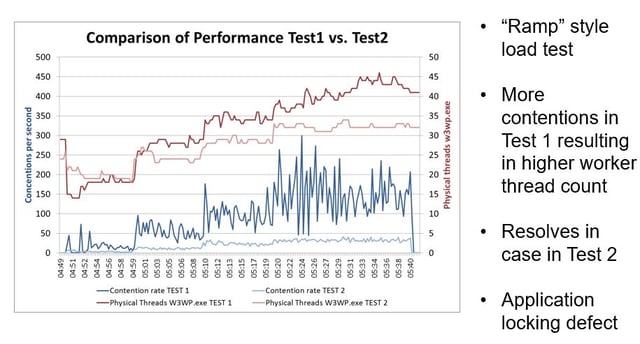
.NET CLR - Contention rate
.NET CLR Locks and threads > Instance > Contention rate per second
the rate at which threads in the runtime unsuccessfully attempt to acquire a managed lock
- Sustained nonzero values may be of concern
- Code synchronization allows only one thread at a time to enter
- Multiple threads attempting to get into this piece of code may become blocked
.NET CLR - Current Queue Length
.NET CLR Locks and threads > Instance > Current Queue Length
The total number of threads that are currently waiting to acquire a managed lock in the application
- If insufficient .NET worker threads are free the counter will increase
.NET CLR - Contention rate vs. Threading

.NET CLR – Bytes in all heaps
.NET CLR Memory> Instance > Bytes in all Heaps
The current memory allocated in bytes on the garbage collection heaps.
- This counter is the sum of four other counters — Gen 0 Heap Size, Gen 1 Heap Size, Gen 2 Heap Size, and Large Object Heap Size
- This value is always less than the Privates Bytes and invariably less that Working set
- W3WP.exe Working set and/or Private Bytes should be monitored independently
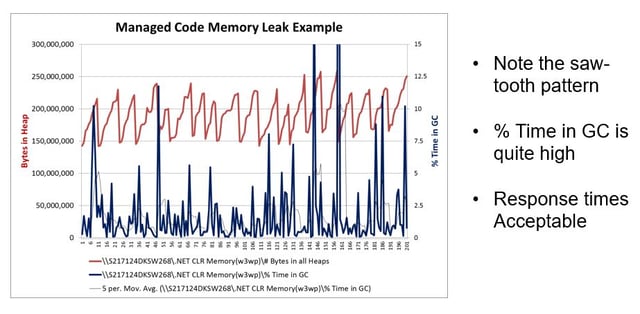
- If this value continues to rise there is a leak in managed code
.NET CLR – % Time in Garbage Collection
.NET CLR Memory> Instance > % Time in GC
The percentage of elapsed time that was spent performing a garbage collection since the last garbage collection cycle
GC mechanism is complex. In brief:
- GC provides a sweep and mark function operates across the heap pools
- “Unreachable” objects are marked for later deletion
% Time in GC gives an idea of the overhead of garbage collection. MS state that this value should be lower than 5% if %CPU is greater than 70%
.NET CLR – Memory Leak

Summary
- 20,000 Feet View of CLR and ASP .NET
- 3 layer model
- Feature of CLR
- ASP pattern
- Managed solutions still require close monitoring
- There are 100’s of metrics that could be examined and only a few were covered here
- Establish baselines for what you expect is “Normal” good behaviour (E.g. Requests per second, Physical threads, etc.)

