
We live in a complex world and the IT services we operate are increasingly complex. It is not unusual for major IT services to deliver hundreds of business processes.
We are often challenged by potential clients that ‘our IT system is too complex to performance test or capacity model – there are far too many business processes so it can’t be done!’
When we look at an IT service we use the following criteria to choose which business processes should be tested/modelled/planned:
- Is the business process invoked many times?
- Is the process business-critical?
- Does the business process have a high capacity cost?
Let us look at the first criterion. How do we identify the high volume business processes where complex systems have hundreds of business processes?
Fortunately we have Wilfried Fritz Pareto to help us. Pareto (1848-1923) was an Italian engineer, sociologist, economist, political scientist and philosopher whose work led to the development of the ‘Pareto principle’. The original work was based on economic observations such as that 80% of the land in Italy at the time was owned by 20% of the population.
The Pareto principle (also known as the 80–20 rule, the law of the vital few, and the principle of factor sparsity) states that, for many events, roughly 80% of the effects come from 20% of the causes.
We will apply the Pareto principle to identify the sources of 80% the demand. I’ll do this using a real-world example. In this case an application we wished to performance test had 26 menus which a user could select from after logging in. Analysis over the peak period reveals the following demand:

Clearly there is a heavy tail to the demand distribution.
If we express the demand for each screen as a percentage of the total demand we find the following:
If we then express this as a cumulative frequency we find the following: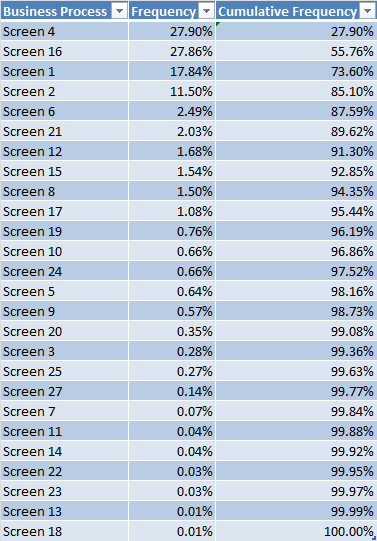
So 4 business processes out of a total of 26 business processes account for 85.1% of the total demand. In other terms, 15% of the business processes account for 85.1% of the demand. This is the Pareto principle in practice.
This methodology helps us identify the business processes that we should concentrate on when we come to modelling and planning the application. Unless screen 13 is business-critical or has a very high capacity cost, why waste time testing or modelling it? More about business-critical and high capacity cost business processes in blogs to come!

