Automatic capacity alerting usually involves setting a couple of fixed threshold lines, which once breached will flag an alert. There are however many other ways of alerting on capacity metrics, many of which not only help to prevent threshold breaches from occurring, but also provide diagnostic information on the type of pattern that has been detected. Here are a few alert and pattern detection types that we use in our own managed services:
- Fixed thresholds: Traditional fixed threshold alerting detects if the metric crosses a set point, e.g. CPU over 80%. Any measured point over the threshold will produce an alert.
 ATASF/Growth: Use to detect change, either increase or decrease, in utilisation or other metrics. This provides a method of detecting real change in capacity utilisation without depending on fixed thresholds, which are only reactive after a threshold has been breached and can be sensitive to occasional spikes. An example of an underlying growth pattern picked up by this technique can be seen in this graph. ATASF uses a statistical methodology to compare the most recent measured set to a historical reference set and generate an index value.
- Threshold Exceptions: Similar to threshold alerting, but counts the number of measurement points which are over the fixed threshold specified, providing a more flexible alert which is less sensitive to one-off spikes.
- Ramp alerting: look for a steady increase in a metric – this can indicate a memory leak or database table filling up.
- Sawtooth patterns: A pattern of gradual increases which end with a sharp decrease, might for instance describe a memory leak which is cleared down at intervals as an application is recycled.
- Simple Loop alert: should be applied to process or core level CPU data. Detect looping processes by looking for processes or cores which remain near 100% utilised for a significant period.
- Spike alert: look for metrics characterised by short sudden peaks of utilisation considerably higher than normal.
- Hum: Detect an unusually high background load by looking at the minimum utilisation over a period, e.g. a hum of 20% CPU means that the CPU usage did not go below 20%.
Each of these, once automated, requires careful calibration to ensure that the alert is sensitive enough but not too sensitive. What level should we count exceptions at? How much variation from the mean indicates a significant growth? How large does a growth/drop pattern have to be to indicate a significant sawtooth? The answers to these questions will vary between applications and services. A good way to calibrate alerts is to apply techniques to a subset of historical data, then examine the results and adjust sensitivity accordingly.
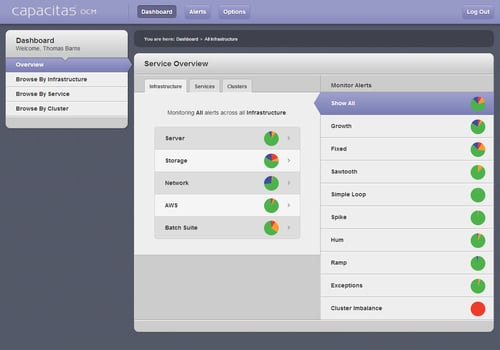
We have implemented a number of these alerting types for the analysis engine that we use in our Operational Capacity Management (OCM) managed services for clients (see image below). This gives us as service providers the ability to focus in on the issues which are starting to happen and catch them early, without trawling through every metric on every server. Also it doesn't need to be just hardware metrics that these are applied to – what about detecting the growth of a batch job run time or looking for spikes in website response time? If you have any interesting examples of how different alerting techniques have been applied do share them.


