We will be going through a multi-part series which describes ways that we can speed up our web page. Even though caching helps to speed up subsequent visits to our webpage, it’s the first visit and experience the user has on your site which can determine whether that user becomes a customer or a regular visitor. In short, having a slow web page can result in the following:
- frustrated users
- loss of business
- negative impact on search engine ranking
With that said, throughout the series we will be working on a fictional webpage and measuring its response time as we apply our optimisations. You can see the website below, (please ignore the aesthetics). Note that this is a very simple webpage, any benefits gained from optimisations are likely to be amplified with a more complex website. The js files used include jQuery and jQuery-ui since these are two js files commonly found on many websites which make use of JavaScript. In the following image, I have used two more components which rely on jQuery to simulate the use of JavaScript on the page (noted in blue on the image). If you don’t know what jQuery is, don’t panic. Put simply, it makes JavaScript easier to implement on webpages without the developer having to necessarily be a JavaScript pro.


OK, so now we know the webpage or ‘test subject’ we’ll be working on, we’re ready to optimise! But hold on, before we can do that, we need to take a baseline of the time it takes for the web page to load at this very minute. We’ll be referring to this measurement as response time. It is very important to have a baseline response time because how do we know whether our optimisations are working if we have nothing to compare future measurements to? To do this, I will be using JMeter to generate 100 sample hits on our webpage. Before reading on, take a look at the picture of our webpage and have a guess at how long you think it takes to load. Now see how you did: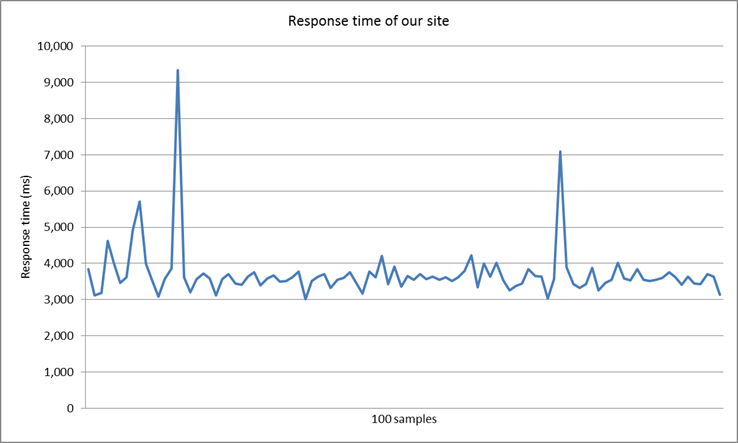
You can see our site took an average of 3.7 seconds to load. I wanted to see where most of this time was being spent so using Firebugs network tab, found that we had a total of 38 HTTP requests for content and that load time was spent as follows: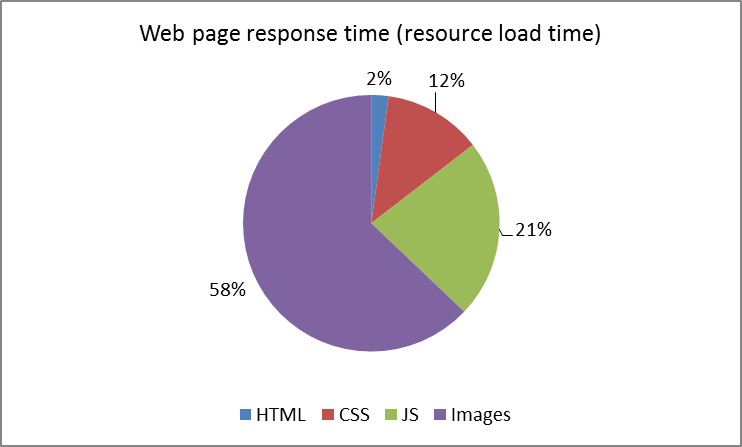
Looking at this chart, optimising our images would be a good place to start and this is what we’ll be looking at in part 2 of this web page optimisation series.
To end, here’s a summary of our progress. We’ll be updating this table throughout the series as we perform our optimisations.
| Stage |
Changes |
# Requests |
Page size (KB) |
Avg response time (s) |
|
1 |
Baseline |
38 |
1,900 |
3.7 |