
Microsoft provides access to a vast array of capacity and performance monitoring counters. These can be monitored through a bundled tool named System Monitor (Sysmon) or through a multitude of third-party tools. The sheer number of counters is often daunting to the uninitiated. This article provides a simple introduction to Windows performance monitoring and a basic set of meaningful performance counters to be monitored on any server.
Sysmon Overview
Sysmon organises performance counters in a hierarchical manner. Performance counters are logically grouped together under performance objects. There are currently 86 performance objects specified on Microsoft Technet.
There may be multiple instances of single counter. These instances may be named, e.g. a logical disk volume, or nominally identified, e.g. a processor number.
The Sysmon syntax for identifying a counter is as follows:
<object\counter(instance)
By way of an example, the capacity utilisation of a processor is defined as the percentage of time that the processor is busy (% Processor Time). In Sysmon the counter that describes the % Processor Time for the second processor in a quad-processor server would be:
Processor\% Processor Time(1)
Note that Sysmon numbers processors 0, 1, 2, etc.
Sysmon also provides in-built instances that are used to summarise multiple instances, e.g:
Processor\% Processor Time(_Total)
Here the _Total instance describes the average of all processor instances. Note that _Total instance can represent a summation in other contexts.
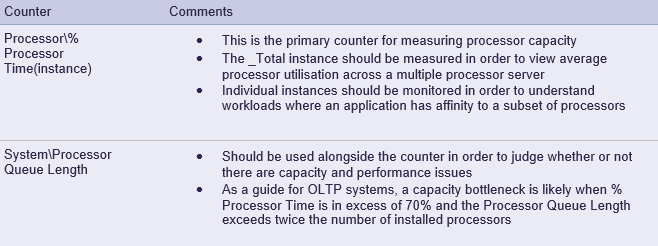
Processor Capacity and Performance Monitoring
The table below describes the performance counters specific to processor capacity that should be part of a base monitoring set:
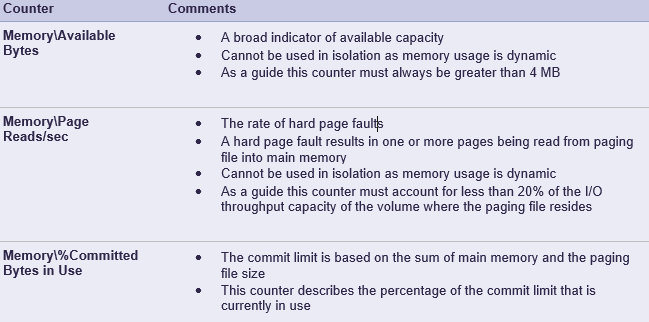
Memory Capacity and Performance Monitoring
The table below describes the performance counters specific to memory capacity that should be part of a base monitoring set:
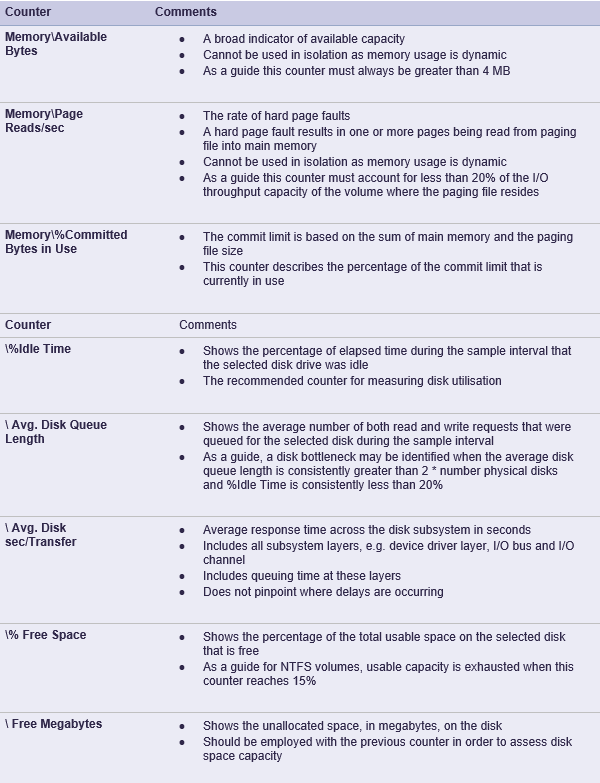
Disk Capacity and Performance Monitoring
The table below describes the performance counters specific to disk capacity that should be part of a base monitoring set. These counters are applicable to both the Logical Disk and Physical Disk objects. Note that these counters describe the disk capacity and performance from the operating systems perspective.
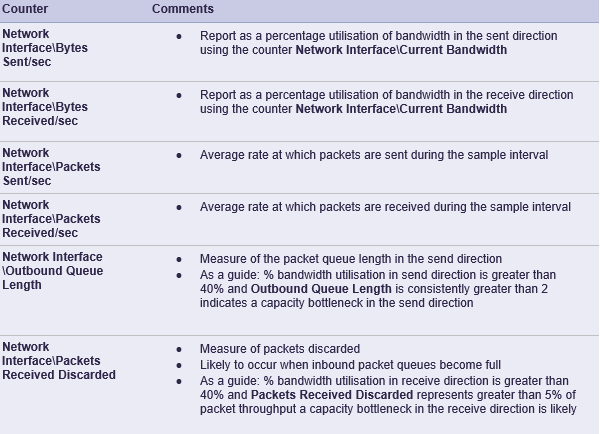
Network Interface Capacity and Performance Monitoring
The table below describes the performance counters specific to network interface capacity that should be part of a base monitoring set:
Summary
This article introduced a basic set of performance counters to use for capacity and performance monitoring key components of Windows. A capacity and performance monitoring strategy would address the following areas not discussed here:
- Monitoring other Windows components such as the file system cache
- Performance monitoring to understand how the global workload is broken down by application
- Monitoring counters required to diagnose performance problems
- Monitoring at appropriate sample intervals
- Monitoring counters to enable application response time to be estimated
- Centrally storing capacity data in an ITIL compliant capacity database (CDB)

