
Full series: capacity modelling guide
As part of a recent client engagement, I built a capacity model of a small, simple application that was reasonably well defined. The process was remarkably straightforward, which is why I think it’s a good example to use to describe the process, in basic terms. This 4-part blog tutorial series will describe the main steps involved in building a model; hopefully it will convince others that it’s not as hard as it looks! The example I am going to use is a model of a simple file transfer system. The model was built completely in Microsoft Excel 2010. Feel free to comment if you’d like to convert any of the tips to a different Microsoft Excel version.
In my experience, the hardest part of capacity management is getting the data that you need. Ideally you need data such as the following, for each service (or application or component) to be modelled:
- Business Data e.g. the number of files being processed*
- Service Data e.g. the number of transactions being processed
- Component Data e.g. storage used, CPU consumed*
- Business Forecasts e.g. expected changes to business demand, either as part of BAU or from specific projects
- Infrastructure specifications e.g. speed and number of CPU cores, storage*
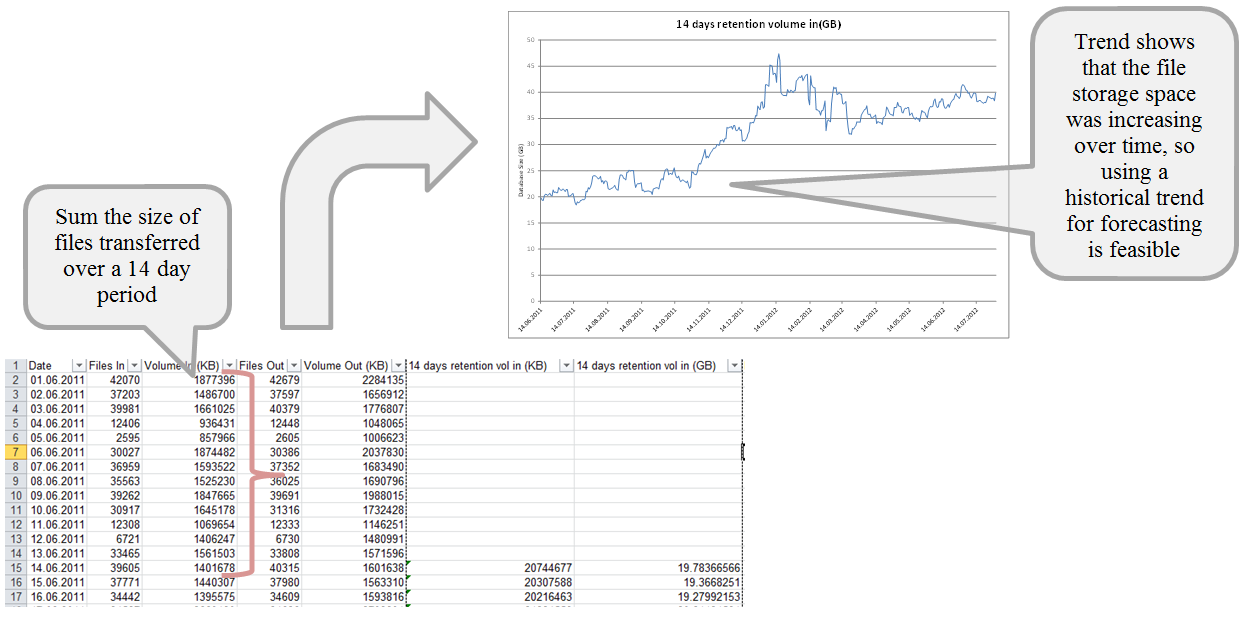
However, it is still possible to develop a model without all of this data. I have marked with an asterisk the data items that are essential to developing a model and that were used in the example described in this blog. In this example, the size of the database was the only resource within scope, as this was the area that had exhibited capacity constraints historically. The business data that we were given described the daily number of files loaded into the application and the component data described the size of those files. We were also told that all data is stored in the database for a maximum of 14 days, so we could determine the file storage space used at any time by calculating the sum of the previous 14 days of data loads (this just includes the storage driven by application files and not any space used for admin or overhead purposes).
When building a model, I usually have three types of sheets:
- Data sheets where the model input and output data is stored. This is where we would store the business/service/component data mentioned above
- Output sheets which store graphs and other interfaces with the user
- Admin sheets which are used for storing variables or other data that is used to operate the model
Given that business forecasts were unavailable, the alternative involves using the historical resource data to determine a trend over time, which can be applied into the future. Before using the trending approach, it’s important to analyse the historical data to determine that a trend exists. This can be done by generating a graph of the calculated file storage space over time.
Given the analysis above we can use the trending approach for developing a capacity model. The calculation of the capacity forecast will be covered in part 2 next week – look out for it!

