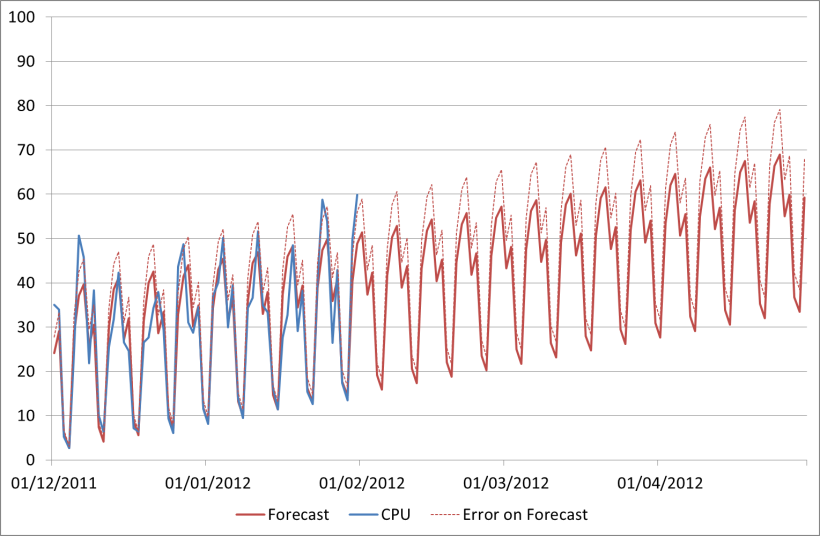
In Basic Time Series Decomposition in Excel I gave a brief demonstration of some simple forecasting methods, showing how to include not only growth but seasonality. By the end of that post we had a forecast like this:

As we mentioned then, there’s still something missing. Maybe not very noticeable in this data set as it has quite a nice seasonal profile, but still missing nonetheless. You can see some of those peaks in the last two weeks were actually about 10 percentage points higher than we forecast. This difference we call Error.
Calculating Forecast Error
Now each data point has a different amount of error; in some places our forecast is nearly perfect, sometimes out by a bit more. I’ve calculated the percentage error for each day. This is shown in the chart below:

You arrive at the amount of error by subtracting the actual figures from the figures in the forecast for each day that we have historical data, then dividing by the actuals again to give a percentage. Our forecast was in column G, and our original CPU in column B, so the error can be calculated for each row as =(G5-B5)/B5 for instance.
This error chart shows that sometimes we are over-predicting, and sometimes under-predicting, with an error of as much as 40% either way. However these are the outliers and generally the forecast is more accurate than that. What we need to do is use this error to provide us with a +/- typical error, which will give us an idea of how accurate our forecasting is in general and also allow us to specify upper and lower reasonable bounds on our future predictions.

One way to do this is to take the Mean Percentage Error, simply by taking the average of all the error values in the above chart. This method is quite attractive, as it is simple, and also it gives us a nice low error value. The Mean Percentage Error for our Time Series Decomposition forecast is only 2% - very impressive!
However that doesn't tell us much – all it means is that we are over-predicting slightly more than we are under-predicting. Because some of our error is negative and some is positive the two are just cancelling each other out.
A better way to get the error is to take the Mean Absolute Percentage Error – which is the same except that we take the absolute values of each point. The absolute percentage error values look like this:
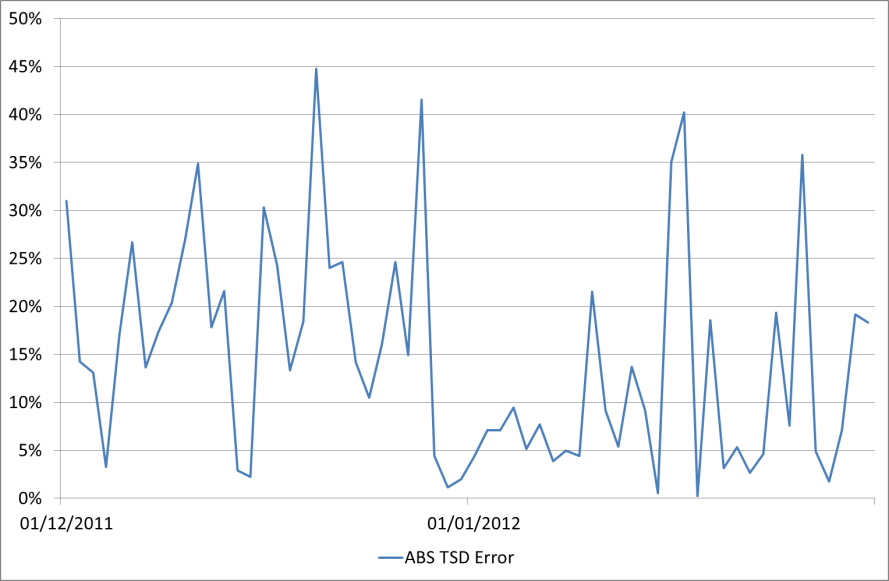
And the average of that is 15%.
It’s easy to calculate this in Excel; simply add a new column taking the ABS() of each percentage error that we've already calculated, e.g. =ABS(H5). Then take the average of all those values.
Forecast method 4 – Time Series Decomposition with Error
Now how can we use this error value to further improve our forecast? Probably the best way is to use it to specify an average upper bound for it into the future. You could also include a lower bound if you were interested but here we are more concerned with how high the CPU might get.
Here is our CPU forecast again, this time with a +15% upper bound for the forecast also shown on the chart:
Our April peak including the error is now 79%. Here is a list of the forecasts we've generated so far using the different methods discussed:
- Guess: 73%
- Linear Regression: 55%
- Time Series Decomposition: 69%
- TSD with Error: 69-79%
So again, the figure we end up with is pretty similar to our first guess! But the key thing is we now have an automated method which anyone can use and understand, and we don’t have to keep looking back at the chart and guessing each time we get some new data – we can simply plug in the data and we will have a revised forecast.
As promised I've tidied up the Excel file and put it on our website with our other downloads and presentations – you can find the link at the end of this post.
Further considerations
So that was one method of doing a time series decomposition forecast. To keep it simple I've just looked at one particular type. However there are a lot of things you could tweak or do slightly differently:
- First, what type of growth is the data really exhibiting? Here for simplicity we've assumed that it’s a linear trend, but it might be exponential for instance. The same methods can be used for the decomposition, but the trend calculations would need to be different.
- Secondly, what about the type of seasonality? Here we have a pattern that repeats every week; however often there are other patterns in the data. Maybe you have a regular busy month end and you need a monthly pattern. Or there might be a typical annual peak. The methodology used would be the same as shown here, just the seasonal patterns and identifiers would need to be different.
- Then there is the difference between Additive (which we’ve looked at here) and Multiplicative Time Series Decompositions. Here we subtract out the seasonality and add it back in, but we could have divided it out and multiplied it back in. Try it and see what the difference is!
- And of course there are lots of different ways to calculate the error, and different ways to add it back in as well. Do we really want to take the average?
Do leave a comment if there are any particular variations you’d like to see examples of.
Limitations
Anyway, now we have the perfect forecast – or do we? Is the CPU really guaranteed to keep growing like that in the future? When doing a time series decomposition forecast it is important to remember the assumption you are starting with – that the data you are analysing will continue to behave the same way in the future as it has in the past.
What if
- A new release increases/decreases resource costs?
- The business has plans to increase the number of users, sales, flights, or whatever?
- Servers are consolidated together or applications moved from one to another?
Maybe the actual CPU will look like this…
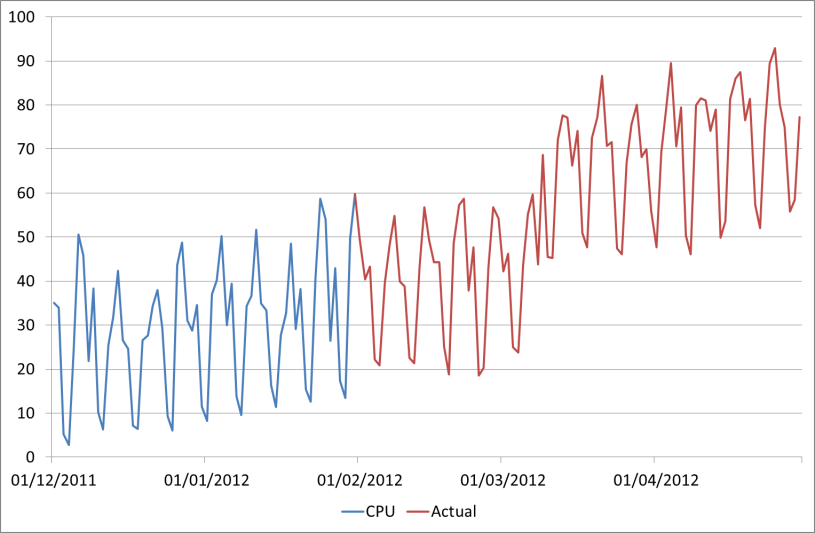
So in summary, the methods that we've looked at for forecasting are very useful, can easily be automated, and are simple to understand. But to take this to the next level we need a business driven forecast, taking into account future plans and projects. Again we can automate this in Excel though it requires some more data and a lot more thought – maybe this needs another blog post!
EDIT: For further posts see:
Forecasting: Basic Regression in Excel
Forecasting - Business driven forecasts using TSD in Excel