
Introduction: Threshold alerting has limited value
Threshold alerts are by far the most common way of detecting operational issues. Your page load times are high, your disks are filling up, your CPU’s are running hot, put a threshold alert on it!
But these kinds of alerts have severe limitations.
Typically you have to make a trade-off between sensitive alerts, (which give many false alarms), or less sensitive alerts, which will not trigger until your customers are already suffering.
Alternatively, perhaps a problem manifests as unusually LOW utilisation, not high. One of our customers failed to notice several serious service issues for exactly this reason. The servers were not overloaded by too much work; the work was not getting through, due to a constraint upstream in the network.
The next step is go for more intelligent alerting. Perhaps different alert levels at different times of the day. Or require a threshold to be exceeded several times in a row. Even with these extensions though, an alert is not going to prevent a problem.

Utilisation alerts are like fire alarms.
They will do NOTHING to prevent problems, and only tell you when it is too late.
Operational Analytics
This article will examine how Operational Analytics is helpful where alerts are not. For a truly robust approach to identifying service risks before your customers are impacted, Capacitas recommends Operational Analytics. Operational analytics is a service specially designed to pick up undesirable pathologies, well before the symptoms become painful.
With our OA service, we have efficiently detected service risks in large IT estates with tens of thousands of servers. This is impossible to deliver by manual methods. In every case, OA is even more powerful when applied to large estates of servers. If you have maybe 20 servers, a manual approach might be practical, but with 20,000 or more, it is a very different story.
PATHOLOGY #1 PROGRESSIVE REDUCTION IN COMPUTE RESOURCES
This is best demonstrated by an example. On a server, the amount of spare memory capacity may be measured using free memory. We often detect progressive reduction in memory capacity, due to badly written software code. This is termed a memory leak. Pattern matching is the best way of detecting the tell-tale ramp shapes that identify a memory leak.
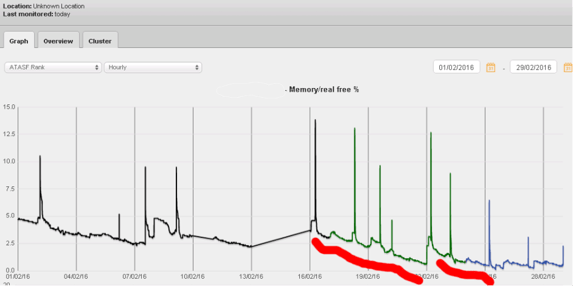
Servers with insufficient memory deliver poor service to your customers, so detecting this pathology early is critical.
With smart software examining long-term memory behaviour for this kind of steady decline, you can tell the difference between a leak, and a situation where all the memory is being used effectively. Note that in the chart above, leaks are being detected when only 2.5% of memory is available. A threshold alert cannot work at this level.
While the example uses a memory leak, the same kind of pattern detection is powerful for detecting any slow reduction in compute resources, before it is too late.
Pathology #2 THE IMPORTANCE OF SMALL STEP CHANGES
OK, let’s continue with the next example of the kind of issue that can be picked up by Operational Analytics.
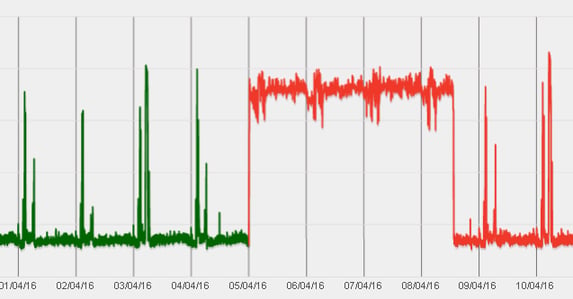
Suppose a software release required more CPU, but not enough to trigger alerts. Would you detect it? Here is an example.
This may not sound serious – after all, there is no immediate threat to service. But suppose your CPU busy levels went from 13% to 25%, (as above)? That’s double the cost per transaction, no thresholds breached. But it reduces your overall ability to handle a peak by half.
WHAT IS THE BUSINESS IMPACT OF A CASE LIKE THIS?
The business impact is clear – when you next have a peak business day, your service would be highly unlikely to manage the demand. Do you want to wait until that peak day to find out?
We have identified cases where code was accidentally released with trace / debug left on, and other cases where what should have been a routine software release had a higher demand for CPU.
Moreover, while CPU Busy is an obvious example, the same applies to many other KPI’s. You would also want to know if a similar change occurred in your response times, your error rates, (such as network packet errors), or your disk busy levels.
Changes in cost per transaction will directly affect the capacity of your service, but this may only become apparent when it is too late. Unless you use a service like Operational Analytics, to pick it up.
Pathology #3 The importance of shifts in minimum values
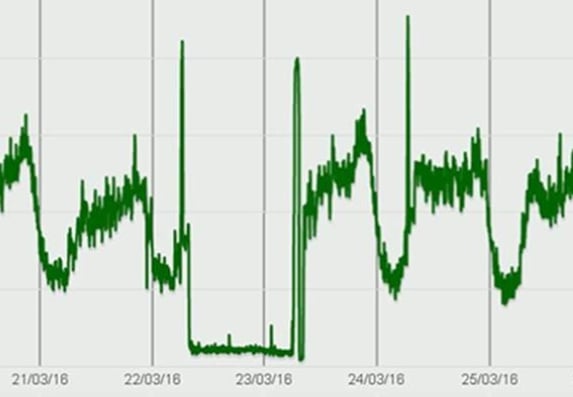
OA can be a powerful way of detecting looping processes, even if it only shows in one core out of many. By spotting a change in the MINIMUM utilisation seen, loops are detected efficiently.
While it is easier to spot if you can measure individual cores, this strategy is also effective in detecting looping processes from the total CPU busy levels.
WHAT IS THE BUSINESS IMPACT OF A CASE LIKE THIS?
Services running against a looping CPU hog will not perform well. But, if you look at overall average response rates, it will be very difficult to detect the small proportion of users getting bad service. Capacitas have successfully used this strategy to efficiently detect the few looping processes on estates of ten thousand servers. Once this was spotted, it was clear from which process was looping, and when it started, that there was a bug in a recent release.
CPU busy is the obvious example for the power of this technique, but it is also effective when applied to error rates, (such as network retry rates), and many other metrics. A step change in minimum response times will promptly detect an unexpected increase in latency, perhaps as the result of a network issue.
Pathology #4 Lower than normal utilisation
As I mentioned earlier in this article, unexpectedly LOW utilisation often indicates a problem.
One of our customers thought that their peak day had gone really well, because their operations bridge reported no issues. The problem was that a partial network failure was preventing a significant proportion of all the transactions from getting through.
The same customer, on the same day, had a reduced rate of success in their payment processing, which they had not picked up on. This also resulted in a significant loss of revenue.
Here’s another example:
An error with setting up the load balancer weightings resulted in a server not getting its share of the workload. Other servers in the pool had additional load – in this case, it was handled successfully, but once again, traditional alerting failed to spot any issues.
WHAT IS THE BUSINESS IMPACT OF THIS KIND OF ISSUE?
This kind of issue can have many different impacts.
- It can manifest as a balance issue, resulting in worse performance at other instances of the component
- A proportion of transactions may fail
- In some cases the customer can retry, and may succeed on a later attempt. This is still frustrating for the customer, of course.
- And in some cases, they will simply take their business elsewhere
A friend who works in incident management summed it up like this. “To understand the problems, I need to know what normal looks like.” With a complex environment, this is not easy, but a good Operational Analytics solution will statistically identify deviations from normal behaviour, in any direction.
Pathology #5 Shifts in response time
OA is a powerful way of detecting undesirable changes in response time, and which elements they affect. Not just response times that are too long, but also response times that are unstable. Your response time is normally the best indicator of the service your users are experiencing.
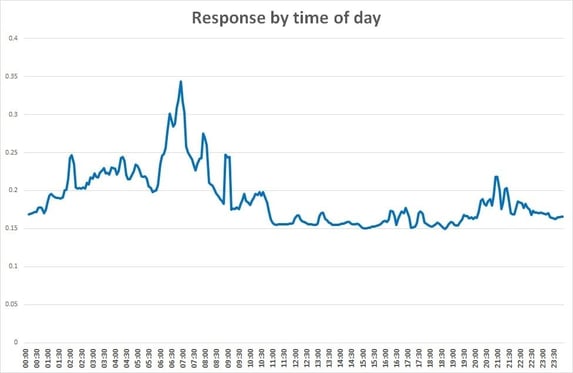
With modern architecture and software, response times should be consistent until the system as a whole is close to its limit. In the example above, we identified that overnight database housekeeping was affecting the live service, and this was then checked, and improved.
It is even more important to address cases where the response time slows as demand goes up. In another case, we detected a response time in a key process that was varying by a few milliseconds, and the slowdown was getting worse. Unfortunately, we failed to convince the customer that this should be taken seriously. They took the view that a few milliseconds was not going to be noticed by their customers, and therefore the issue was not important.
The response times grew geometrically, and then that service component failed.
Also, a step change in minimum response is a powerful way of spotting looming latency problems.
Detecting slowdowns before Service Level Agreements are breached is clearly preferable to reacting after the event. Detecting slowdowns before your customers are even aware of them is a key factor in keeping those customers.
OPERATIONAL ANALYTICS - NOT REAL TIME
It is worth noting that Operational Analytics does NOT run real time. Because it picks up underlying problems before they become incidents, it does not need to. This also means it has no overhead, as the logs can be shipped off the production servers at a quiet time of day, with no impact on your live service.
Article Summary:
In this article, we have seen how Operational Analytics can be a powerful tool for detecting issues that are impossible to detect reliably with threshold based alerting. These issues include:
- Memory leaks
- Important small step changes
- Shifts in minimum utilisations
- Dangerous reductions in utilisation
- Response time changes

Related posts:


