
A UK retailer with annual revenue of £700m p.a. had a stock management system. The system tracked and ordered stock for the company’s 150 stores. The workload profile of the system was seasonal, with a major peak at Christmas.
The retailer was experiencing poor performance across the entire application. One key business process, goods receipting of deliveries to stores, took 30 minutes to run, slowing down deliveries. The board had little confidence ahead of the forthcoming peak. If performance could not be improved, the retailer would revert to manual processes.
We were engaged to find out what the problem was and how it could be fixed. Timescales were tight – we were asked to report back our initial findings after 10 days.
We conducted system performance analysis to identify 3 key system bottlenecks - A CPU bottleneck on the application server, an I/O bottleneck on the database server and a logical bottleneck on the database server.
We ran a controlled test to perform the Goods Receipting process (2 steps) with a single user.
The Goods Receipting application resulted in two eight-minute long periods of 100% CPU Time on a single logical processor. Further analysis indicated that the application process GRGoodReceipting.exe used this CPU resource and it was a single-threaded process.
The Application Server was a configured with 2 hyper-threads. So this was the 100% of one logical processor was the maximum CPU that could be consumed by this process.
This indicated that the application server was CPU bound.

The workload on the database server showed that 22% of SQL Server transactions were conducted against the database and 75% were conducted against tempdb. tempdb is a system database used by SQL Server to store temporary tables and temporary stored procedures for subqueries, sorting and aggregation.

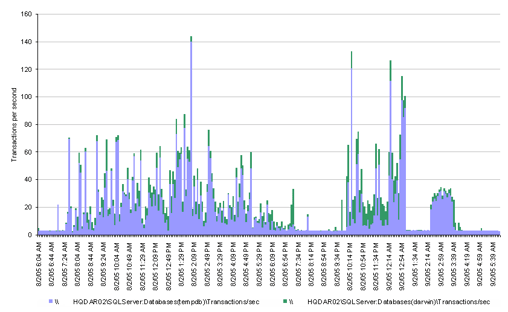
This then prompted us perform bottleneck analysis of the disk that hosted tempdb database files.
We observed very high disk write response times, often in excess of 1 second. This is represents really poor performance! Note that write activity to tempdb is likely to be synchronous.

When we looked at queue lengths on the disk, our diagnosis of a disk bottleneck were confirmed. Here we see average queue lengths of over 9,000 requests!

We identified 2 solutions to this issue. Firstly, faster disks. Secondly, a reduction in the use of tempdb through more efficient code. This brings us on to the third bottleneck.
In addition to the production observations, we conducted a series of performance tests. The goal of testing was to isolate known slow transactions and determine their impact on system resources. Single user testing was conducted on an unloaded system, between 5am and 8am, running read-only transactions on the production system.
Windows Performance Monitor and SQL Profiler were used to monitor a number of business transactions in isolation on an otherwise idle system.
Of particular interest was the Goods Receipting business process. The Goods Receipting process allows staff in a remote warehouse to keep a record of the stock that has been received from suppliers.
We designed a test to identify logical bottlenecks from inefficient SQL. The test comprised 3 phases:
Separate SQL Profiler traces were taken at each phase.
The elapsed time of the test was 38 minutes. It was clear that most of the time was spent in Step 2:

Analysis of the SQL Profiler trace during Step2 showed a single SQL statement took over 23 minutes to complete (as measured using a stopwatch) and used over 22 minutes of CPU (as measured using SQL Profiler)

Remember – these are response times for a single user test on an otherwise unloaded production system!
The developers rewrote the SQL code and the execution time for the transaction was reduced from 23 minutes (1,380 seconds) to 26 seconds. This had a direct impact on the end user experience.
Benefits

If you want to see big boosts to performance, with risk managed and costs controlled, then talk to us now to see how our expertise gets you the most from your IT.

